16 November 07
Pitch By Pitch
 Josh Kalk is a sabermetrics god. This past baseball season marked the widespread deployment of a measurement system (called PITCHf/x) to track location and velocity of every pitch. The motivating reason for this was to provide animations of each pitch for MLB.com’s Enhanced Gameday application, but a few baseball stat geeks discovered they could extract the underlying pitch measurement data and started to do analyses with these.
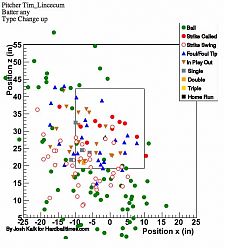
Enter Josh Kalk, who has built up a database of about 300,000 pitches from this season and has presented these graphically on the web. At left is an example of one of his plots. This graph shows the location of all the changeups thrown by Tim Lincecum of the Giants that were captured by the system. The view is from the catcher’s direction; the box in the middle is the strike zone.
Another view of these data is provided by his player cards, such as this one for Tim Lincecum. Kalk has developed an algorithm to separate different types of pitches (i.e. sliders from changeups from fastballs etc.) and these are shown plotted in different symbols on these graphs. In another set of charts he also graphs pitches for each batter, such as this chart for Red Sox slugger David Ortiz.
Previous: Hometown Stars Next: Tertials and Telescopes

Holy statistics, Batman! This is the kind of information you can’t imagine ever needing but are fascinated that it exists to be contemplated. (And does Mr. Kalk have a day job? If so, his boss should probably look over his shoulder once in a while.)